Active Risk Allocation (ARA) update:
Our primary indicator has pointed towards that investors should reduce risk assets since around Christmas. The same indicator is now falling fast through neutral driven by a shift in asset correlations primarily due to a break upwards in Treasury prices.
| Factor group | Tendency |
| Fundamentals | Worsening |
|
Economic activity remain lacklustre despite global centralbank intervention through 2019. Our proprietary leading activity indicator suggest activity is below potential and moderating. China has been a bright spot in its vast contribution to global growth post the Global Financial Crisis. However, we are quite convinced that the future will generate far less growth than the 5-7% pa officials and consensus analysts expects. |
|
| Risk & Volatility | Factors are increasing that points towards higher risk |
| The liquidity wave created by centralbank interventions have at the same time increased correlation between asset and undermined diversification benefits. As a consequence even mixed portfolios today have increased vulnerability towards fat tail events. | |
| Market Intelligence | Stable with a twist from fixed income |
| Sentiment indicators from the financial markets are overall neural, indicating no bigger worries on the horison. | |
| Technicals | US treasury bonds break upwards |
|
The US long bonds are gaining positive momentum, in the process breaking the falling wedge formation established since September 2019. Treasuries thus joins gold in our “recession basket” indicator pointing towards weakness in economic activity. Equities remain overall in an upwards trajectory, but momentum has now turned neutral. |
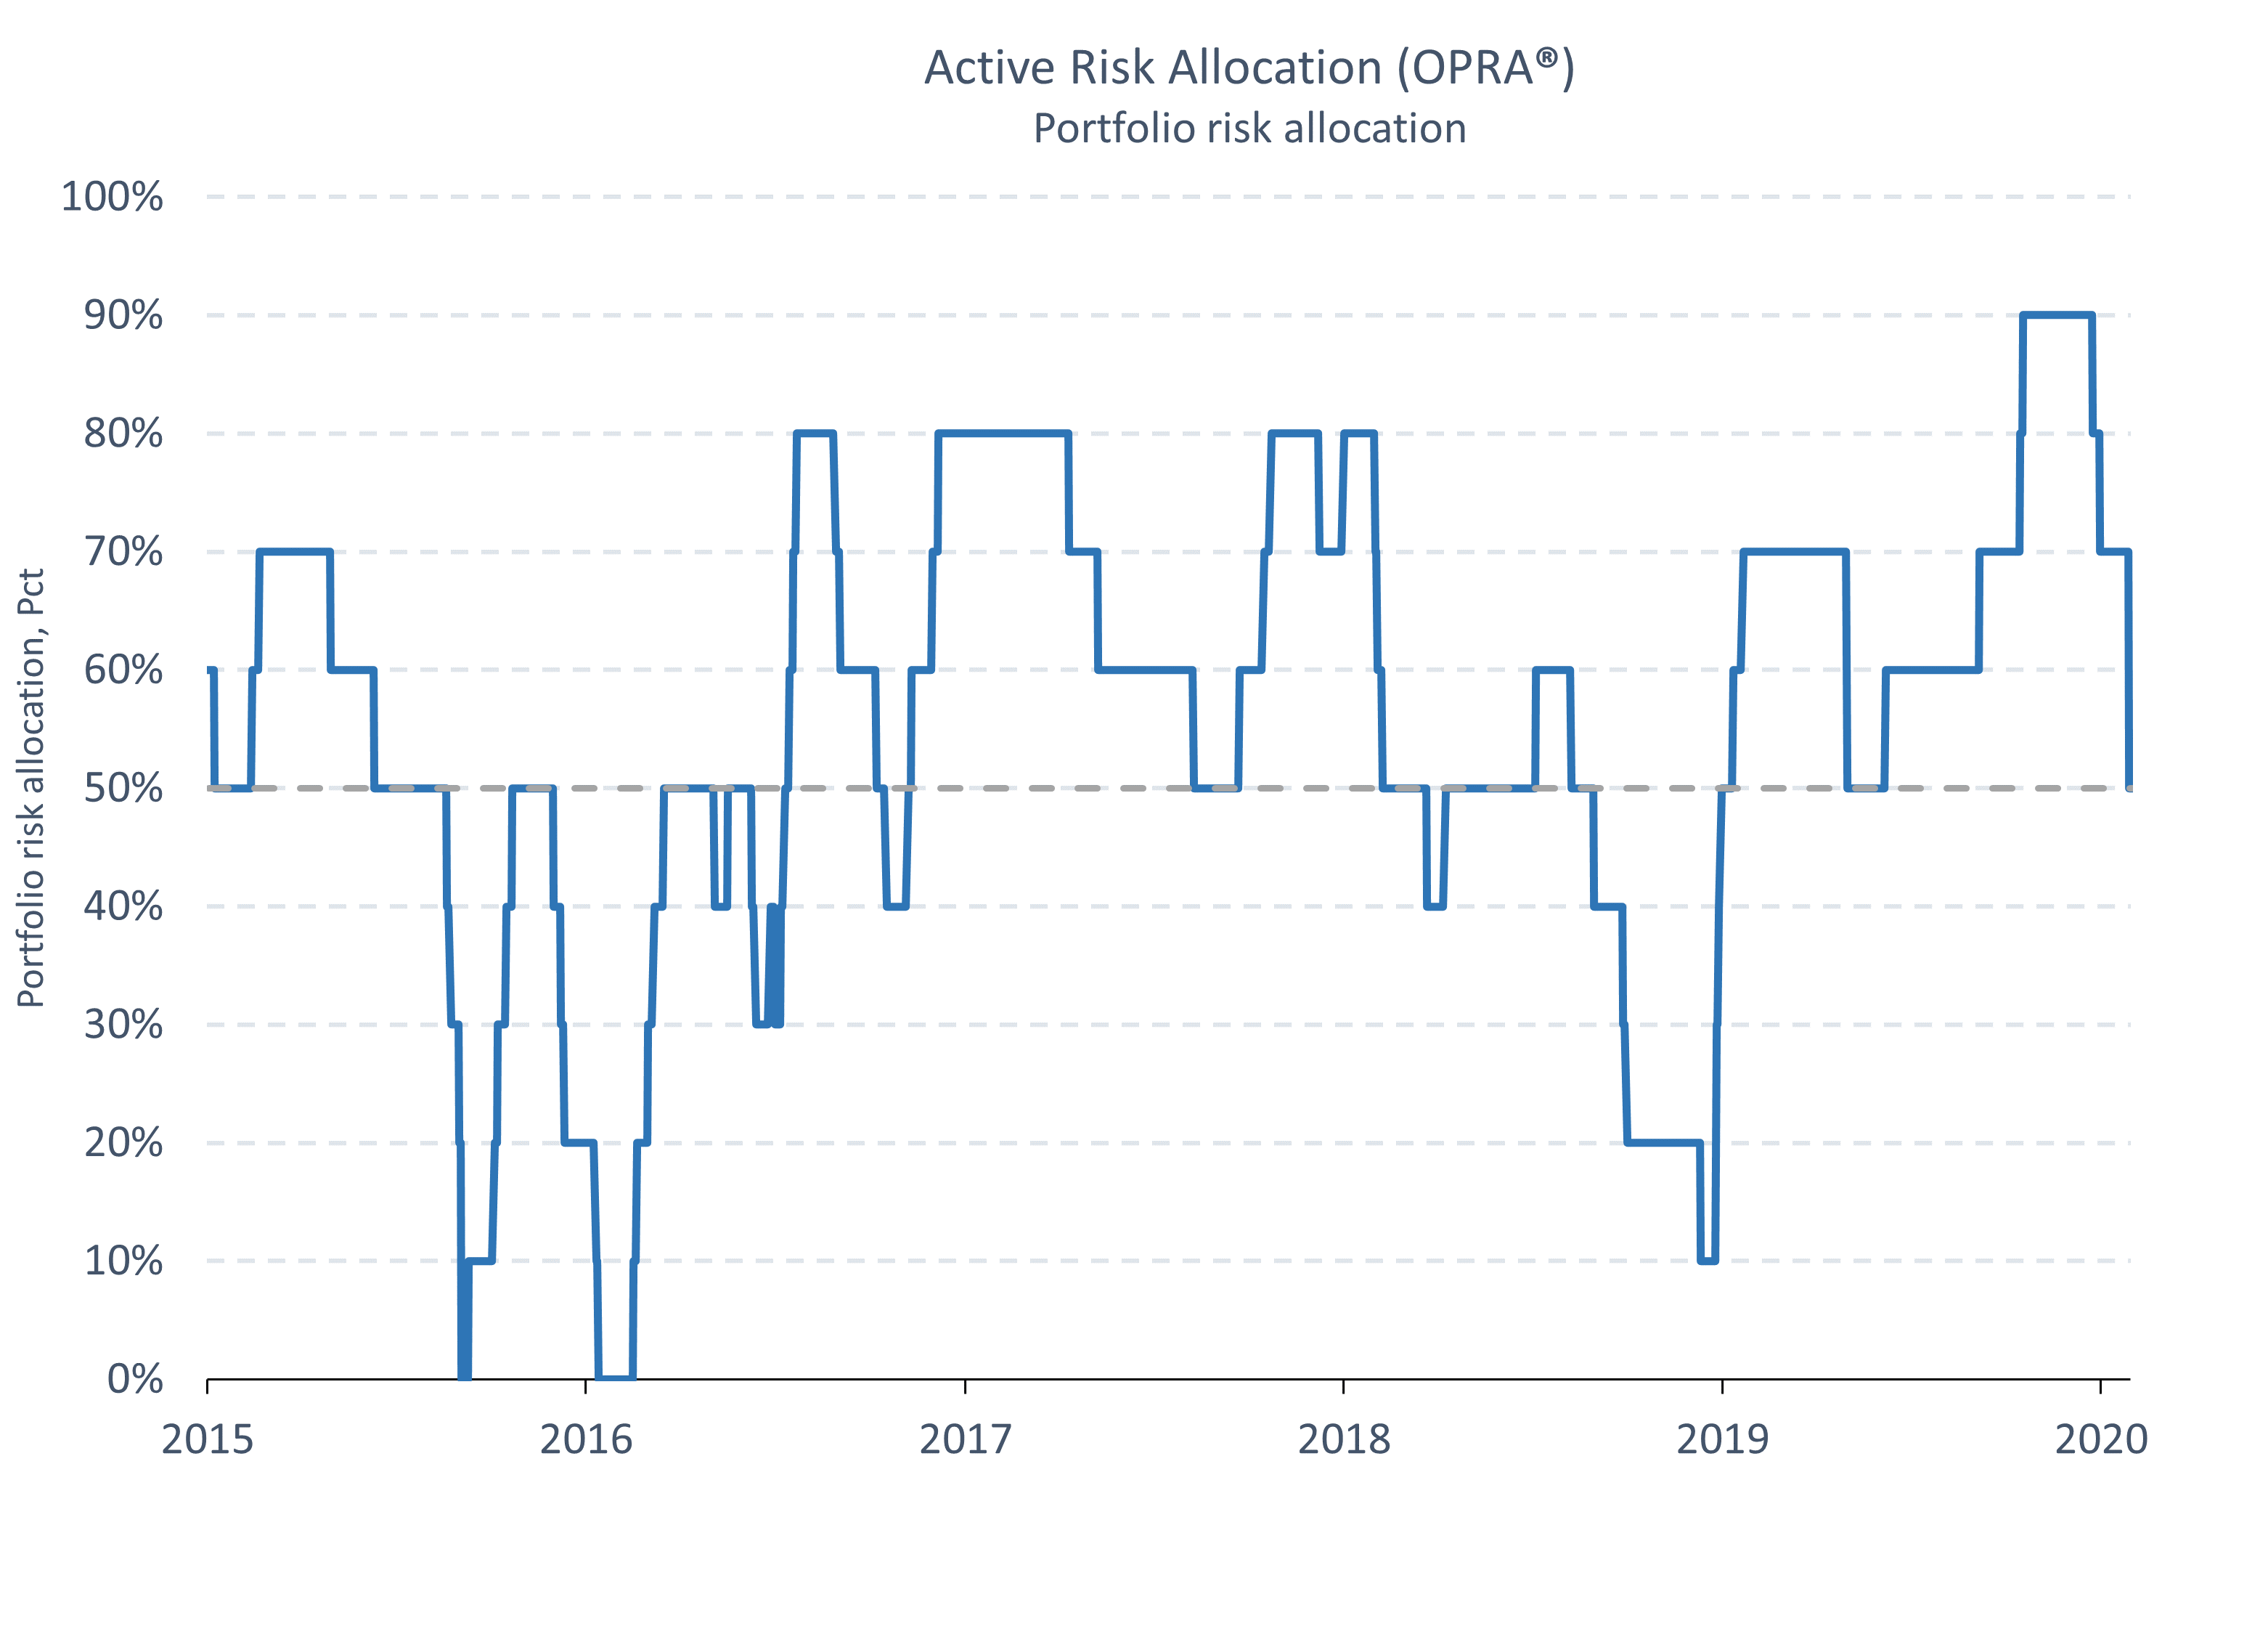
Proprietary indicators
Our Portfolio Risk Allocation indicator drop through 50% indicating a maximal risk exposure of neutral to benchmark. Dynamic however continue to show a rapidly deteriorating tendency.
_____________________________________________________________________________________
A primer on our approach (nerdy)
Origo’s Asset Allocation advice is built on a simple observation: Much of the portfolio theory taught in (Business) school is useless. Not because it is wrong, but because it does not deal with real life situations.
We believe it is necessary to be systematic and pragmatic at the same time. In practical terms this means that follow the same indicators day out and day in, but we do not expect them to play the same roles all the time. In particular, we look for changes – short term and long term – in the correlations between the main asset classes.
We have classified all the 150 or so variables we monitor daily in four broad groups:
Macro- and microeconomic factors (the Fundamentals)
These always win in the long run. But while waiting for this to happen, important possibilities may have been lost. So while this group of factors are very important, mostly they give the background.
Risk and volatility factors
This group of variables are based on actual day-to-day observations. We consider cross-asset correlations, volatilities and diversification risks. Certain correlation patterns are important indicators of trouble to come
Market Intelligence
This is a headline for all data indicating the ephemeral “market sentiment”. A large number of survey data exist giving indications of the markets’ perception of risk. Some markets, in particular swap markets, as well as short term money markets and forex markets give important real-time indications of the shifting market sentiments
Technicals
No introduction necessary. Technical factors are valuable but cannot stand alone. They need to be seen in conjunction with other variables. When used carefully, they can be used to identify major turning points in both directions.
Our proprietary indicators
Our understanding of the market dynamics needs to be made actionable in order to be useful.
Hence, we have taken the most important of the factors mentioned above and aggregated them into two main indicators, a market risk indicator and a portfolio risk allocation indicator.
Our market risk indicator combines some fundamental factors, some volatility and correlation element as some sentiment data to give an indication of the current risk situation. We call this the Origo Market Risk Indicator, OMRI.
A strong asset allocation is the basis for any satisfactory long-term return. Asset allocation is always built on a diversified portfolio where the correlations between assets change over time. We have found it very useful to group asset classes in “risk assets” and “non-risk assets” instead of “stocks and bonds”.
Our portfolio risk allocator (OPRA) summarises the max recommended holding of risk assets in a diversified portfolio – based on any “strategic” limitations a given investor has to consider. An institutional investor may e.g. hold between 25 and 75% in risk assets. So when our OPRA says 30%, this investor should hold 25% in risk assets plus 30% of the difference between min and max allocation. This client should hold 25% + 15% equals 40% in risk assets – in the lower end of the permitted range.
Portfolio composition
We construct a portfolio by optimising (i.e. minimising) the risk dispersion, subject to the constraints set by OMRI and OPRA and any constraints set by a higher authority, such as the law or the board of directors.


Reading Time: 3 minutes